


0
US Dollar Index
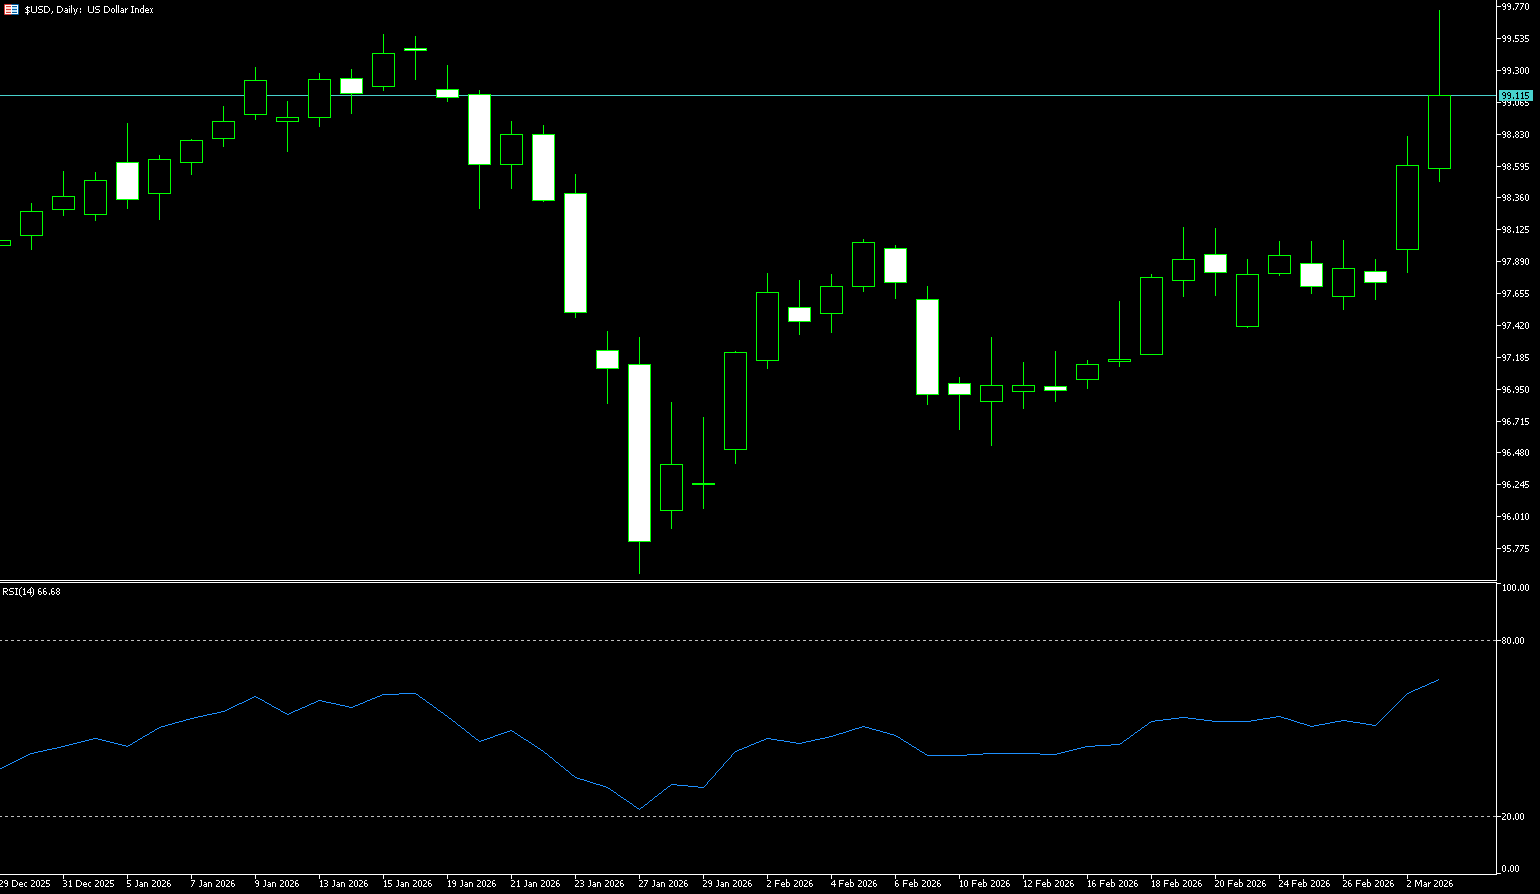
The US dollar index surged above 99.20 on Tuesday, after rising nearly 1% in the previous session, supported by safe-haven inflows as the risk of war between the US and Israel escalated further. A senior US official stated that Washington is preparing for a large-scale attack on Iran within the next 24 hours, targeting the country's missile production facilities, drone programs, and naval assets. The dollar was also supported as the conflict drove up energy prices, with markets anticipating this would exacerbate inflation and reduce the likelihood of a near-term interest rate cut by the Federal Reserve. Markets have pushed back their expectations for the next Fed rate cut to September, from a previous forecast of July, although two 25-basis-point cuts are still anticipated. Meanwhile, high energy costs and inflationary risks are putting pressure on the currencies of other major energy-importing economies, particularly in Europe and Japan.
Whenever US-Iran tensions rise, the US dollar often becomes the dominant currency in Asian and global markets. Since international crude oil is primarily priced and settled in US dollars, when oil prices rise sharply, countries must hold more dollars in the market and pay for the same amount of oil. This rigid demand will create a "liquidity shortage" in the US dollar in the short term, thereby pushing up the exchange rate. Technically, the US dollar index is currently near the middle of its trading range and has the potential to challenge the upper limit at 99.23 and the resistance zone at 99.66 (280-day simple moving average). A break above this level could lead to a challenge of the psychological level of 100. On the downside, a clear break below 98.68 (240-day simple moving average) and 98.43 (Tuesday's low) would open the way to deeper support at the psychological level of 98.00.
Today, consider going long on the US dollar index near 98.94; stop loss: 98.80, target: 99.28; 99.40
WTI Crude Oil
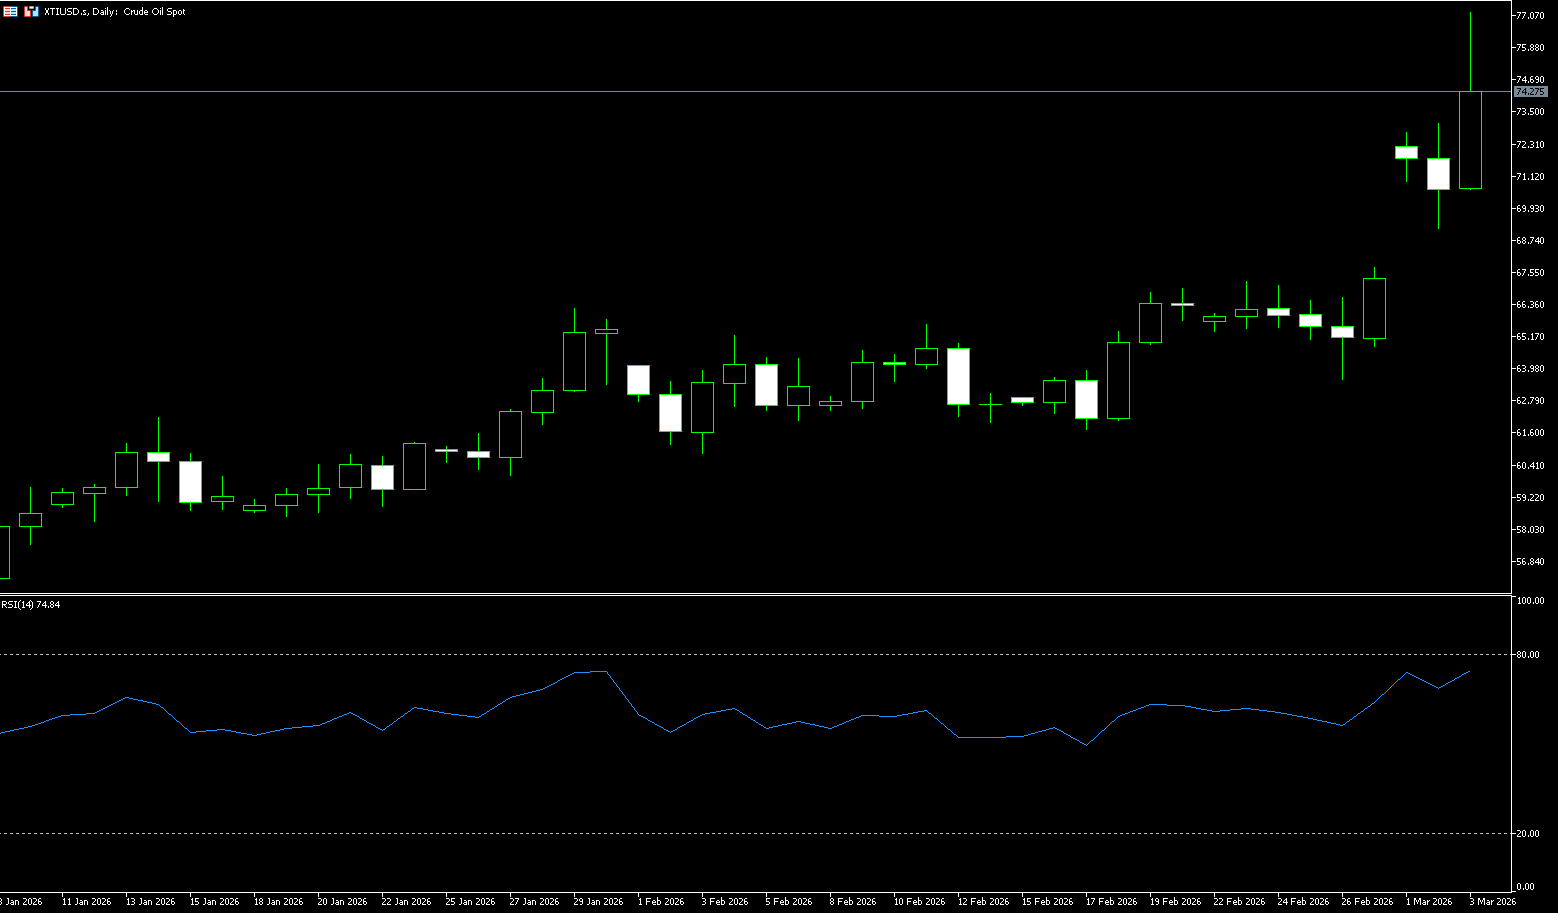
WTI crude oil rose about 6% on Tuesday, breaking through $75 a barrel, after rising about 6.5% in the previous session. Traders are focused on the escalating tensions in the Middle East and the increased risk of a complete closure of the Strait of Hormuz. When asked how long a war with Iran might last, Trump stated that the United States would "take all necessary measures." A senior U.S. official also indicated that the U.S. was preparing for a major escalation strike against Iran within the next 24 hours, targeting its missile production, drones, and naval assets. Meanwhile, a senior Iranian official warned that ships attempting to pass through the Strait of Hormuz could be targeted. The Strait of Hormuz is a major bottleneck for global oil shipping, accounting for approximately one-fifth of global oil shipments, and has been effectively brought to a standstill due to escalating security risks. Saudi Aramco has also temporarily suspended operations at its Ras Tanura refinery, the kingdom's largest, as it assesses the damage following the drone attack.
Ultimately, the core issue in the current oil market is no longer "whether there is a shortage of oil," but rather "whether it can be safely transported out." A moderate-intensity conflict would keep risk premiums high, anchoring oil prices in the $70-80 range; while every marginal deterioration in the situation would allow Wall Street to reprice oil prices to $100. From a daily chart perspective, the 14-day Relative Strength Index (RSI) is hovering around 78. While in overbought territory, it highlights strong momentum, consistent with a floating upward tone rather than impulsive buying. Immediate support is seen at $73.20 (early week high), followed by the psychological level of $70. On the downside, the key support level is the uptrend line held since the beginning of the year, currently at $64. The upside target is initially $76.74 (June 2025 high), with resistance estimated at $80 (psychological level).
Today, consider going long on crude oil around $74.10; stop loss: $74.00, target: $75.50; $76.00
Spot Gold
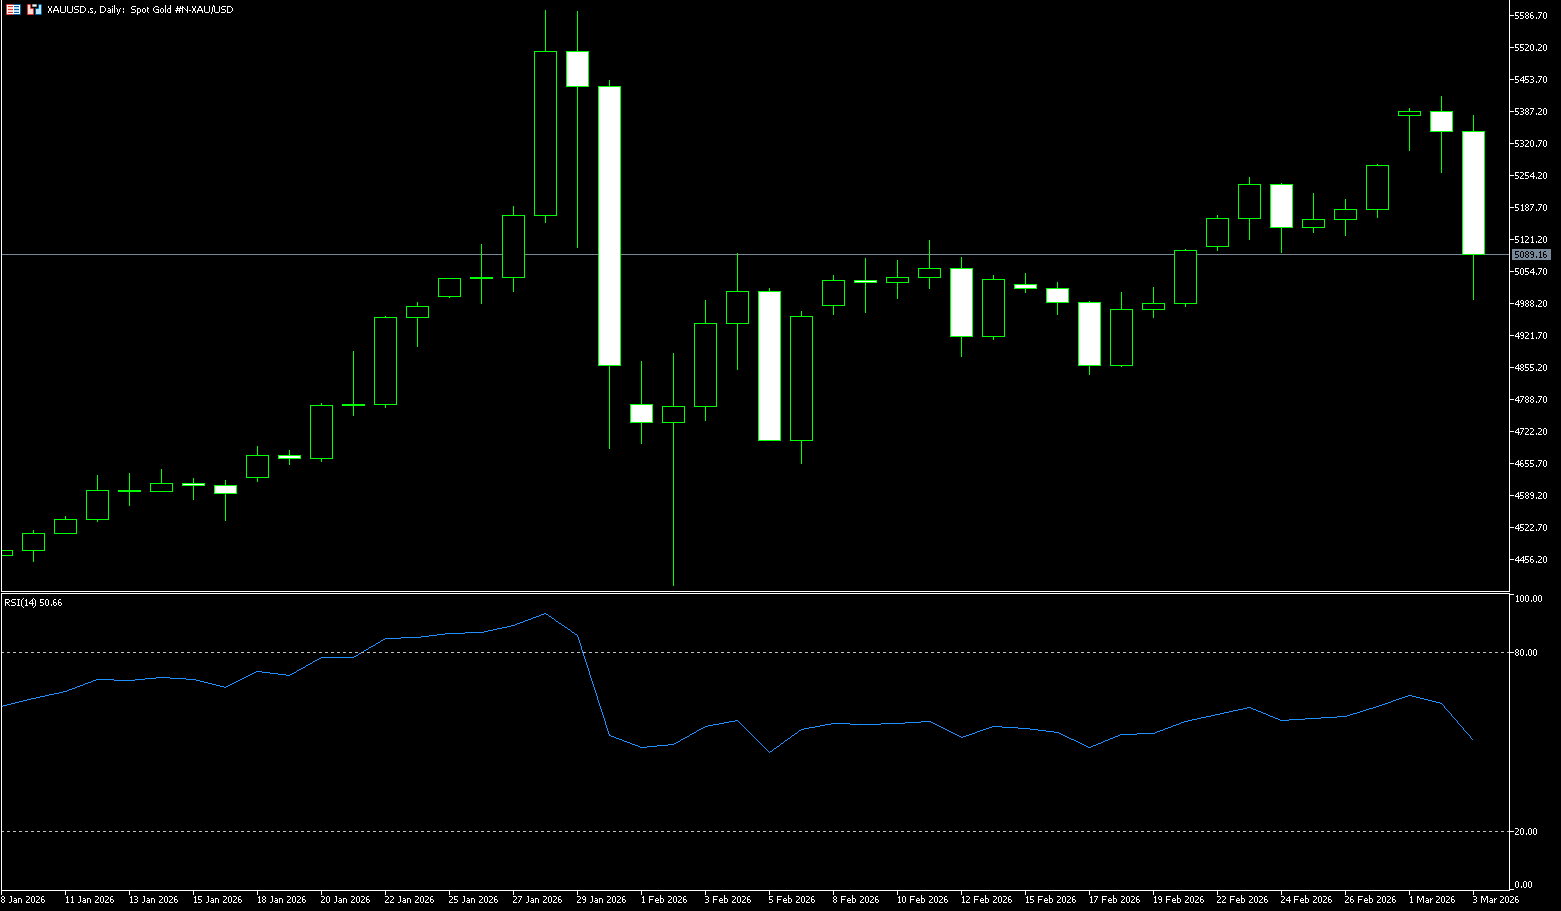
Gold fell nearly 5% on Tuesday to around $4,997 per ounce, as investors increasingly viewed the dollar as a safe haven amid escalating geopolitical tensions. The dollar strengthened as investors sought refuge amid soaring energy prices caused by the Middle East conflict. Rising fuel costs exacerbated inflation concerns, pushing bond yields higher and prompting markets to reassess the Federal Reserve's policy trajectory. Expectations for the next Fed rate cut have been pushed back from July to September, although two 25-basis-point cuts are still priced in. Meanwhile, the US military is expected to escalate its operations against Iran, potentially targeting missile production sites, drones, and naval assets. A senior Iranian official also warned that ships attempting to pass through the Strait of Hormuz could be targeted, effectively halting tanker traffic amid heightened security risks.
Spot gold surged to $5,420 on Monday as risk aversion dominated financial markets. The short-term bias is bullish, as gold prices remain above the rising 20, 50, and 100-day simple moving averages, with short-term averages clustered around $5,245-$5,250, while longer-term averages are trending downwards towards the $5,050 and $5,000 area, reinforcing the positive fundamental trend. Despite recent volatility, a broader uptrend remains intact. Meanwhile, technical indicators maintain an upward slope within positive territory, consistent with potential for higher highs. Momentum indicators have slowed somewhat but remain above the midline, while the 14-day Relative Strength Index (RSI) is stable near 60 but still trending downwards, reflecting a slippage without suggesting lower lows. On the upside, immediate resistance lies near the 9-day moving average around 5,170; a sustained break above this area would open up opportunities to 5,250 and the psychological high of 5,300. On the downside, watch for $5,000 (a psychological level), followed by the $4,997 area (Tuesday's low), with a break below that targeting $4,900.
Consider going long on gold around 5,080 today; Stop loss: 5.070, Target: 5,160; 5,180
AUD/USD
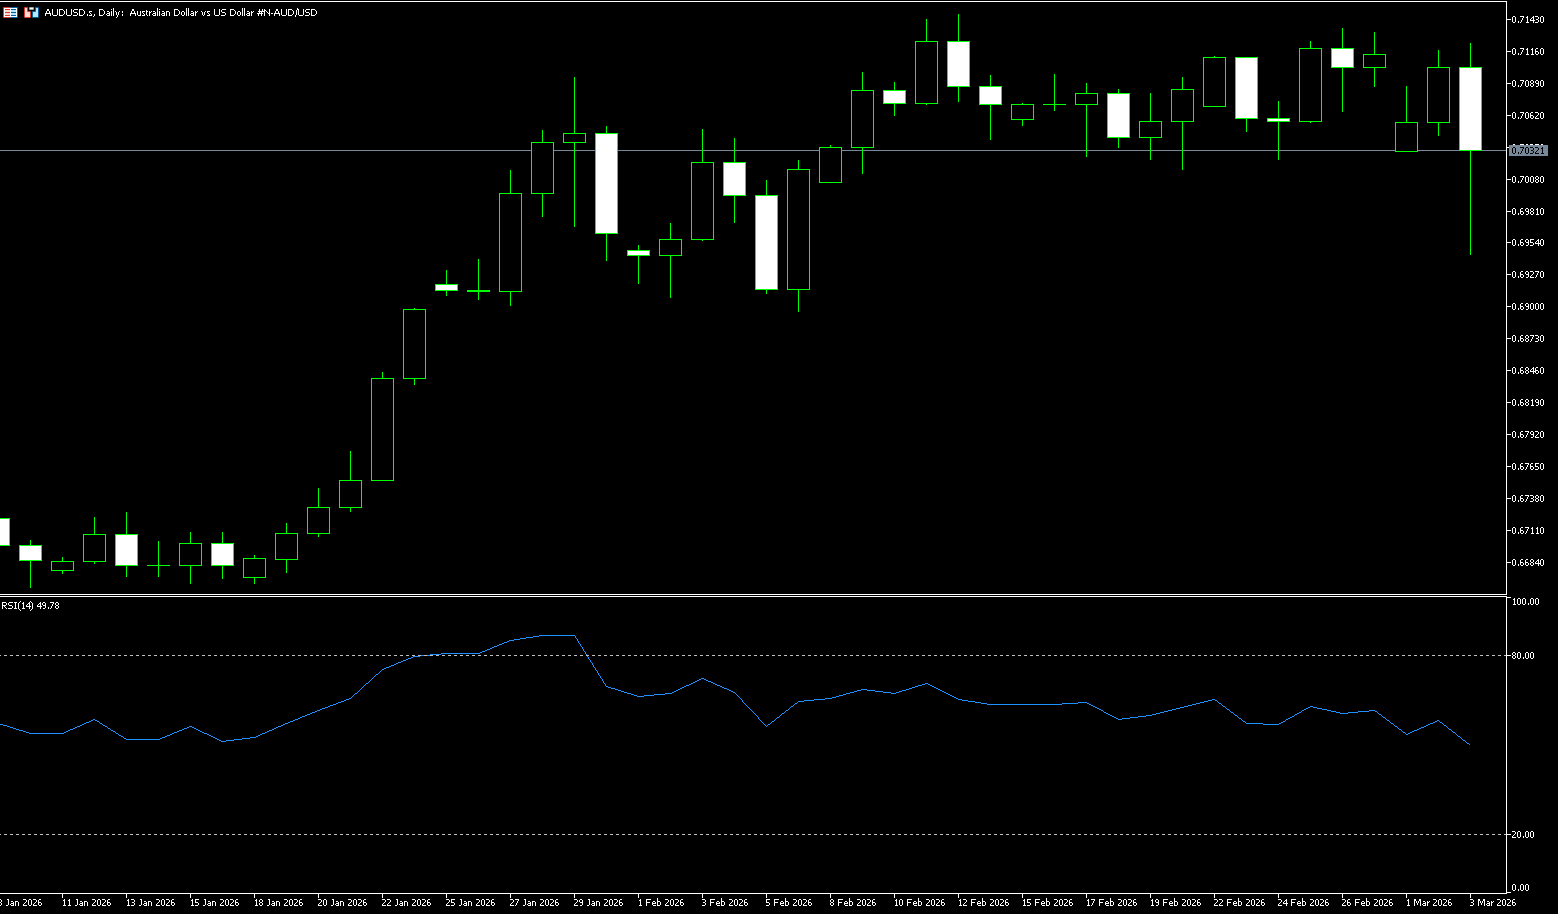
The AUD/USD pair experienced an intraday rise to the 0.7120-0.7125 area in the first half of Tuesday's European session, attracting new selling pressure and continuing its steady intraday downtrend. In the past hour, the spot price has retreated to around 0.7000, with bears targeting the lower boundary of the multi-week trading range support, as the US dollar has generally strengthened. Traders have reduced their bets on three Fed rate cuts in 2026 due to persistently high inflation. Furthermore, the rapid escalation of geopolitical tensions in the Middle East continues to drive funds to traditional safe-haven assets, which in turn has pushed the US dollar to a new high since January 20 and weakened the Australian dollar, which is considered riskier. Meanwhile, the US State Department urged its citizens to leave Middle Eastern countries immediately due to serious risks. In the absence of any relevant market-driving data, future geopolitical headlines will drive demand for the US dollar and provide some impetus for the AUD/USD pair ahead of Wednesday's Australian Q4 GDP report.
On the daily chart, AUD/USD is trading slightly above 0.7000, with a short-term bearish bias. Currently, the spot price is firmly above the rising 55-day, 100-day, and 200-day simple moving averages, which are clustered between 0.6628 and 0.6897, forming a solid medium-term uptrend. The pair is currently holding firm at the 0.7000 level (a psychological key level), indicating that the latest pullback is shallow within the broader uptrend. This creates a key demand zone for buyers to defend the uptrend. A break below 0.7000 would target 0.6944 (the 40-day simple moving average), while the 14-day Relative Strength Index (RSI) has retreated from overbought territory to the 52.15 area, indicating that momentum, while cooling, remains positive. On the upside, immediate resistance lies near 0.7080 (the 9-day simple moving average). A daily close above this area would pave the way for the 0.7100 (psychological level) target.
Consider shorting the Australian dollar near 0.7045 today; Stop loss: 0.7058; Target: 0.7000; 0.6900
GBP/USD
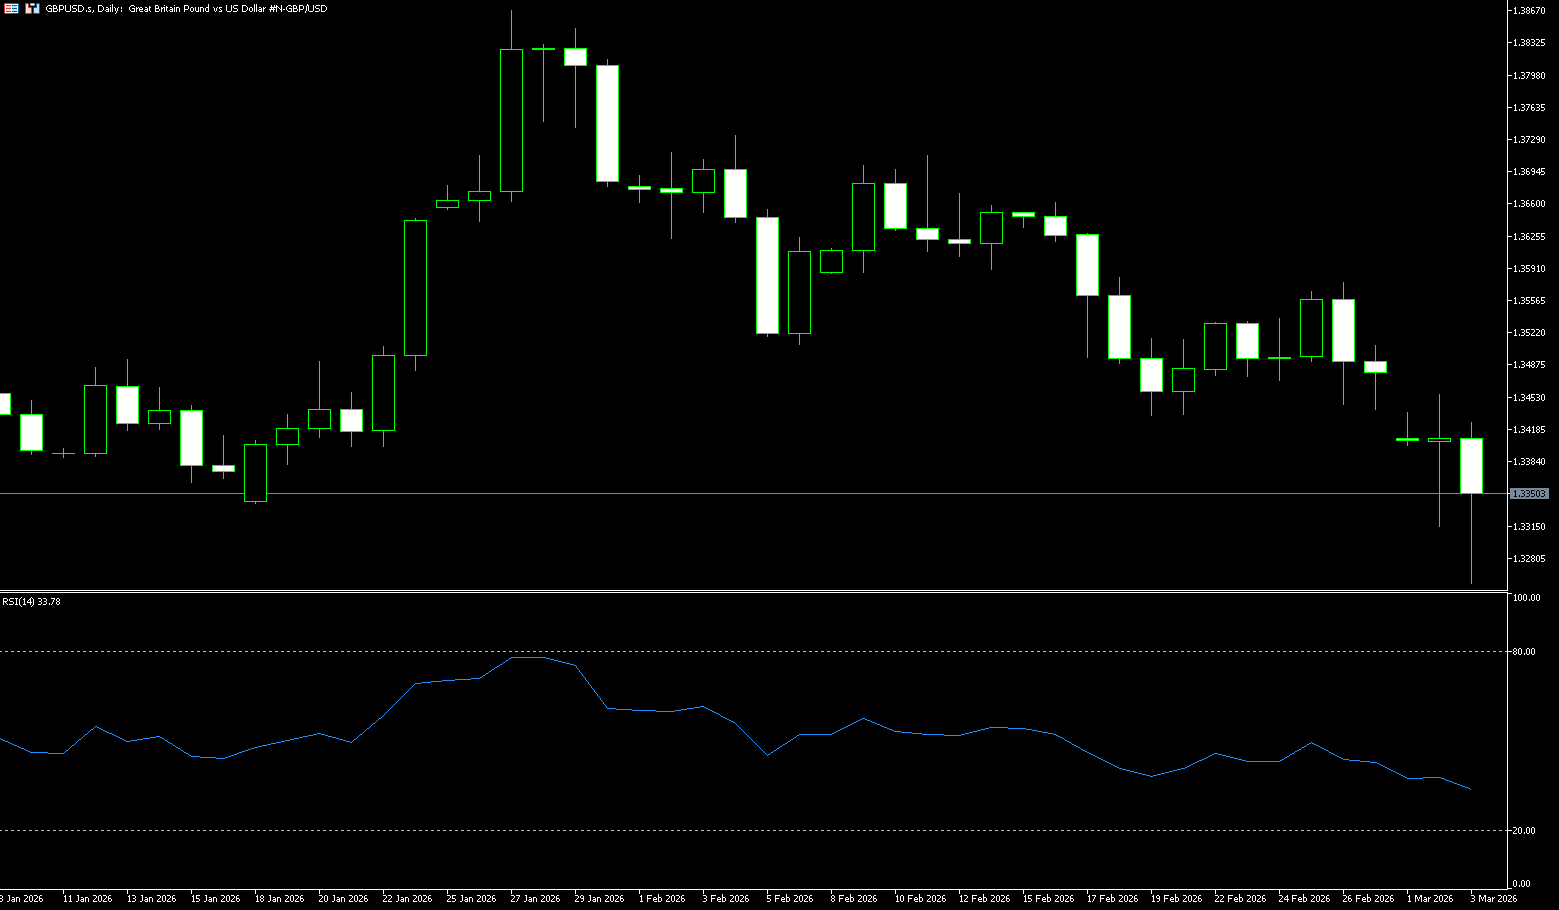
The pound fell to 1.3253 in early March, below $1.3300, its lowest level since December 2025, as risk aversion fueled a dollar rebound amid escalating tensions in the Middle East. The US and Israel launched a coordinated strike against Iran over the weekend, killing Iran's Supreme Leader Ayatollah Ali Khamenei. In retaliation, Tehran attacked US assets in its neighboring country. Increased domestic political uncertainty, exacerbated by Labor's unexpected losses in Gordon and Denton, seats Labor easily won in the 2024 general election, further pressured the currency. This result has increased concerns about Starmer and Chancellor Rachel Reeves, with fears that they may be replaced by ministers pushing for higher fiscal spending, potentially further exacerbating public finances pressures in the UK.
On the daily chart, GBP/USD is trading around 1.3353. The short-term bias is slightly bearish, as the spot price has broken below the 50-day simple moving average at 1.3538, while the 200-day simple moving average, hovering around 1.3447, has now become dynamic resistance. The recent failure to sustain gains above 1.36 has resulted in a series of lower closes, and the daily stochastic oscillator, after retreating from overbought levels, remains near 40, indicating weakening momentum rather than a full bearish reversal. This suggests a consolidation above recent lows rather than a sustained downward breakout. A break below 1.3300 (the psychological level) and 1.3280 (Tuesday's low) would confirm a deeper correction towards 1.3250 (the 300-day simple moving average).
Consider shorting the British pound around 1.3365 today; stop loss: 1.3376, target: 1.3300; 1.3310
USD/JPY
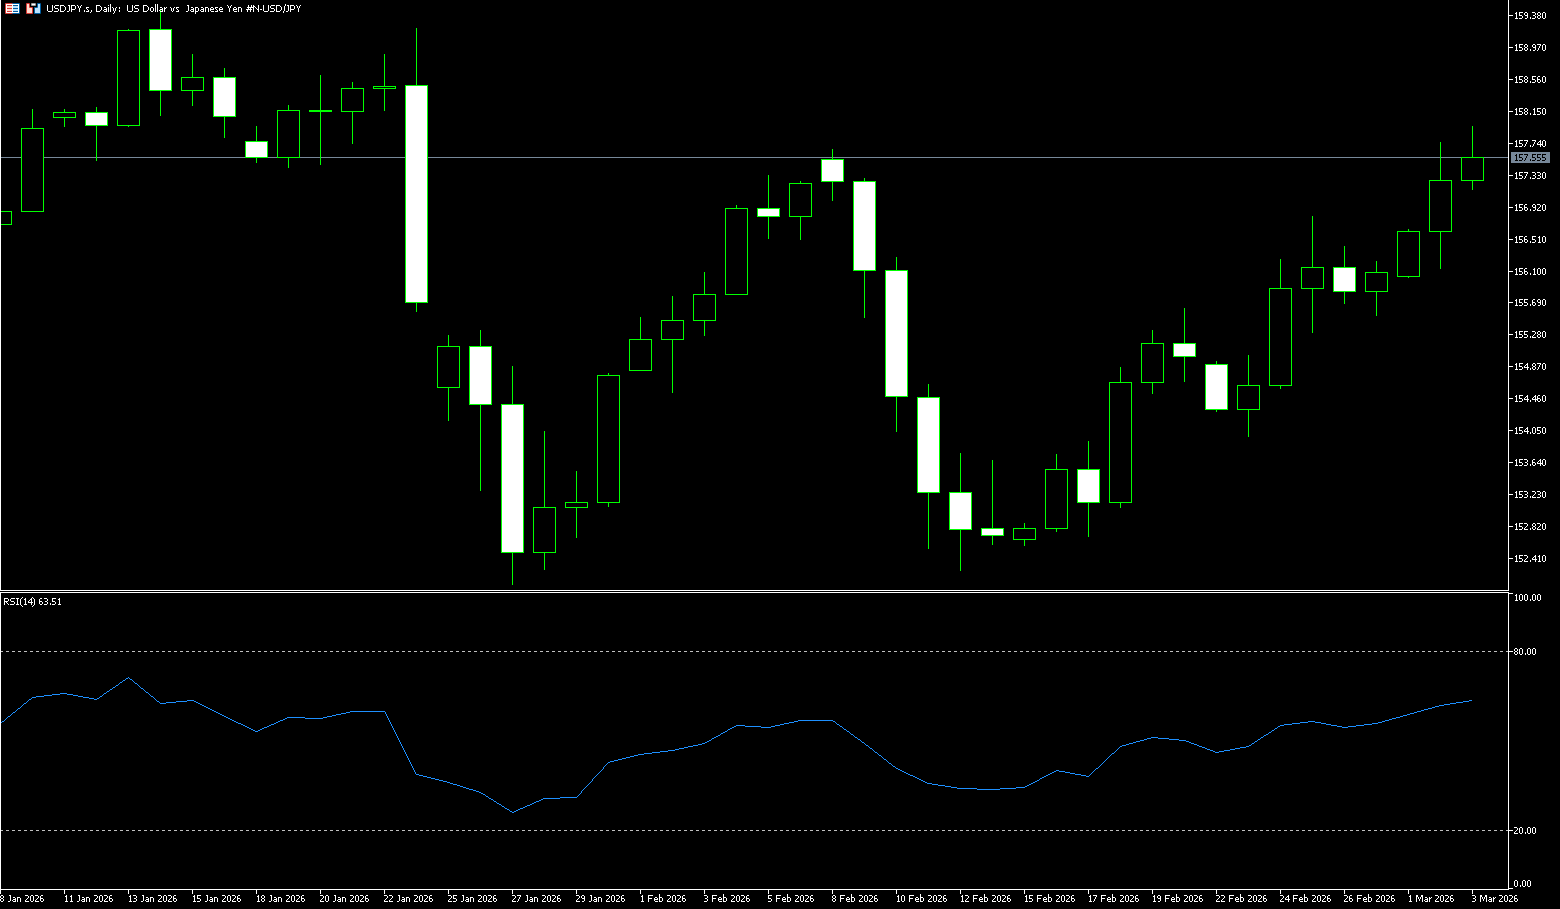
The USD/JPY pair jumped to near a three-week high of 157.97 this week. The dollar strengthened against the yen due to stronger-than-expected US economic data. Bank of Japan Governor Kazuo Ueda will speak later. Data released Monday by the Institute for Supply Management (ISM) showed that the manufacturing Purchasing Managers' Index (PMI) fell to 52.4 in February from 52.6 in January. This figure was better than the market expectation of 51.8. The optimistic report complicates the path of the Federal Reserve's interest rate cuts. The market currently expects a high probability of no change at the upcoming March meeting. The US and Israeli attacks on Iran have entered their third day, and US President Trump said on Monday that US military action could continue for weeks or longer. Concerns about a larger war in the Middle East and ongoing geopolitical risks could drive up safe-haven currencies such as the yen in the short term. Hawkish comments from Japanese officials could also support the yen.
From a technical perspective, the recent multiple bounces and subsequent rallies from the 100-day simple moving average (155.34) breakout zone are favorable for bullish traders. The MACD line has turned upward above its signal line and is now back in positive territory, suggesting improved upward momentum after losing momentum mid-month. The 14-day Relative Strength Index (RSI) is around 63.30, remaining above the midline and not approaching overbought territory, consistent with the gradual upward trend. Immediate resistance levels are at 157.75 (early weekly high) and 158.00 (psychological level), where the latest rally stalled and supply re-emerged. A close above 157.75-158.00 would pave the way for 159.45 (January 14 high), and a break above that would expose the psychological zone of 160.00 as the next upside target. On the downside, initial support lies at 156.69 (5-day simple moving average), guarding against a deeper retracement towards the 156.00 level, where the previous low coincides with the short-term consolidation base.
Consider shorting the US dollar today near 157.75; Stop loss: 157.90; Target: 156.30. 156.50
EUR/USD
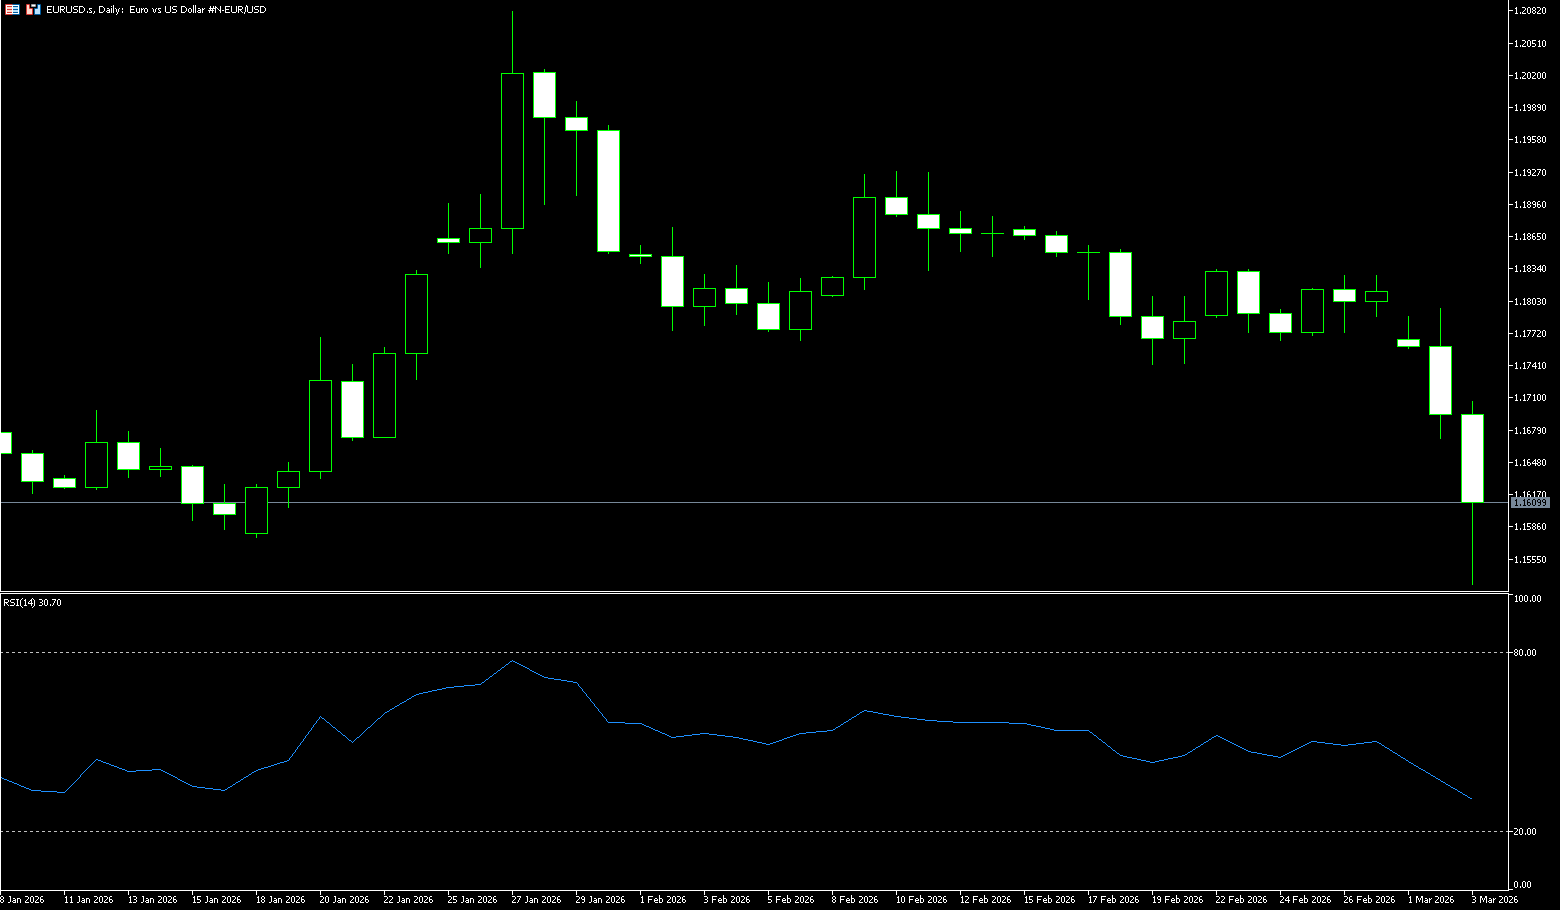
The euro was flat in early trading, trading below $1.16, its lowest level since mid-January, as the dollar strengthened on safe-haven demand amid escalating conflict in the Middle East, despite stronger-than-expected inflation data from the eurozone. US President Donald Trump indicated that military action against Iran could last four to five weeks, but emphasized that US troops are prepared to extend the operation if necessary. Meanwhile, rising energy costs following the formal closure of the Strait of Hormuz and the continued stagnation of Qatari LNG exports are expected to exacerbate inflationary pressures in Europe, potentially prompting the European Central Bank to adopt a more hawkish monetary policy stance. Eurozone data for February showed annual inflation unexpectedly reaching 1.9%, with core inflation at 2.4%, both higher than expected. Last week, ECB President Christine Lagarde stated that she expects overall inflation to approach the 2% target in the medium term, despite uncertainty surrounding the outlook due to Middle East tensions.
On the daily chart, EUR/USD Trading around 1.1600. The pair has pulled back below the 210-day simple moving average, which is around 1.1649, while still challenging the 250-day simple moving average around 1.1565, maintaining a slightly bullish but weakening bias. The 14-day Relative Strength Index (RSI) has fallen to 39, indicating that upward momentum is weakening after recently failing to maintain gains above 1.18. Immediate resistance is at 1.1649 {210-day simple moving average}. This limited the recent rebound, with higher resistance at 1.1700 (the psychological level). A daily close above 1.1700 would reopen the path to 11800. On the downside, initial support is at the 250-day simple moving average of 1.1565, with deeper support at 1.1500 (the psychological level). A break below this level would expose even lower support and suggest a shift to a broader bearish phase.
Consider shorting the Euro today around 1.1623; Stop loss: 1.1635; Targets: 1.1570, 1.1560
Disclaimer: The information contained herein (1) is proprietary to BCR and/or its content providers; (2) may not be copied or distributed; (3) is not warranted to be accurate, complete or timely; and, (4) does not constitute advice or a recommendation by BCR or its content providers in respect of the investment in financial instruments. Neither BCR or its content providers are responsible for any damages or losses arising from any use of this information. Past performance is no guarantee of future results.
Lebih Liputan


Pendedahan Risiko:Instrumen derivatif diniagakan di luar bursa dengan margin, yang bermakna ia membawa tahap risiko yang tinggi dan terdapat kemungkinan anda boleh kehilangan seluruh pelaburan anda. Produk-produk ini tidak sesuai untuk semua pelabur. Pastikan anda memahami sepenuhnya risiko dan pertimbangkan dengan teliti keadaan kewangan dan pengalaman dagangan anda sebelum berdagang. Cari nasihat kewangan bebas jika perlu sebelum membuka akaun dengan BCR.
BCR Co Pty Ltd (No. Syarikat 1975046) ialah syarikat yang diperbadankan di bawah undang-undang British Virgin Islands, dengan pejabat berdaftar di Trident Chambers, Wickham’s Cay 1, Road Town, Tortola, British Virgin Islands, dan dilesenkan serta dikawal selia oleh Suruhanjaya Perkhidmatan Kewangan British Virgin Islands di bawah Lesen No. SIBA/L/19/1122.
Open Bridge Limited (No. Syarikat 16701394) ialah syarikat yang diperbadankan di bawah Akta Syarikat 2006 dan berdaftar di England dan Wales, dengan alamat berdaftar di Kemp House, 160 City Road, London, City Road, London, England, EC1V 2NX. Entiti ini bertindak semata-mata sebagai pemproses pembayaran dan tidak menyediakan sebarang perkhidmatan perdagangan atau pelaburan.

 English
 简体中文
简体中文
 繁體中文
繁體中文
 Bahasa
Melayu
Bahasa
Melayu
 Tiếng
Việt
Tiếng
Việt
 ไทย
ไทย
 日本語
日本語
 한국어
한국어
 ភាសាខ្មែរ
 español